
A. INTRODUCTION
In this case study we will evaluate a 14 m deep excavation supported by an anchored bored soldier pile wall (metric W610X82 steel beams in 0.91m bored holes @3.05m spacing).
The model is simulated with the DeepEX software program.
The excavation was originally studied in a paper by Cao L.F., Peaker S.M., Ahmad S (SPL Consultants Limited, Ontario, Canada).
In the original publication, the authors presented their evaluation of the performance of the excavation.
The purpose of this exercise is to evaluate how different deep excavation analysis methods (Limit equilibrium, non-linear with elastoplastic soil springs, and finite elements method) compare to each other, and how close the different methods can approximate the measured moments and displacements in different construction stages.
Field investigation with drilled boreholes revealed that the site stratigraphy consists of about 9.3m stiff silts and clays, over a layer of shale and limestone.
The groundwater table was about 5 m below grade. Assumed soil properties, as presented in the original paper, are summarized in table 1:
Table 1: Assumed Soil Properties (From the original soil investigation as presented in the paper)
(i) Top soil parameters

(ii) Rock Parameters

B. ORIGINAL PROJECT – MEASURED DISPLACEMENTS AND BENDING MOMENTS
According to the original paper, 2 slope inclinometers and 127 reflective targets were installed to monitor the displacement of the shoring walls during and after excavation.
The bending moments were deduced based on the inclinometer measurements.
The following images illustrate the monitored displacements and deduced moments in different construction stages.
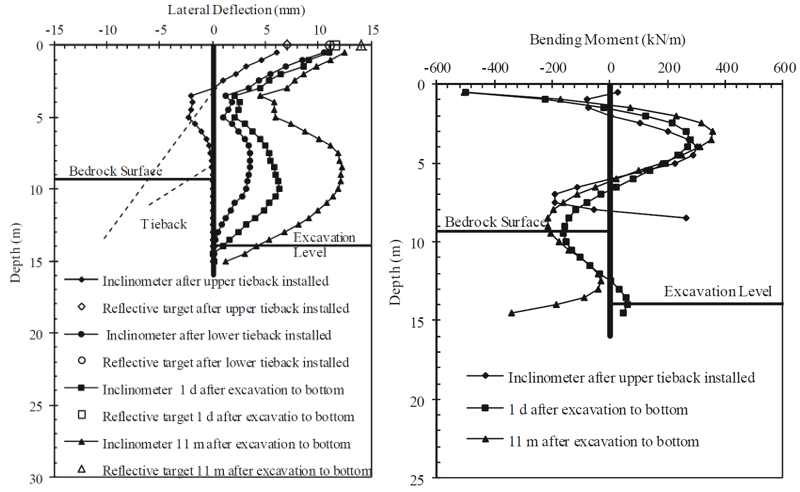
Figure 1: Monitored Displacements and Deduced Bending Moments of the Soldier Pile Wall.
C. SIMULATION IN DEEPEX SOFTWARE
The model was simulated in DeepEX – Shoring Design software considering all the construction stages. The following modelling methods are used for the analysis of the excavation: Limit Equilibrium, Non-Linear and Finite Element Analysis.
The following image presents the generated model in the last construction stage.
Table 2 below presents the soil properties used within the software.
Table 3 presents the ground anchor properties.
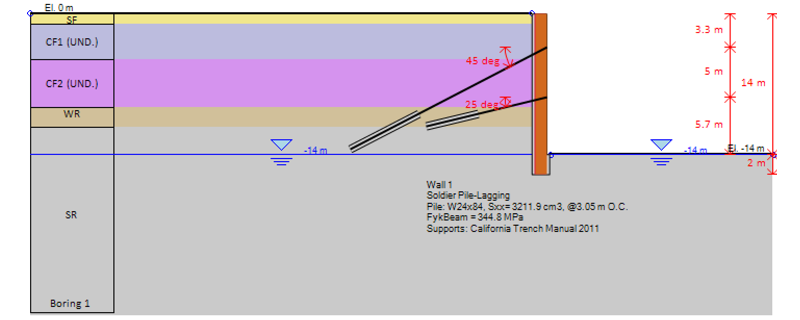
Figure 2: The model as created in DeepEX software – Last Construction Stage.
Table 2: Soil Properties and Stratigraphy in the DeepEX Model
Elev. (m) | Soil | Soil Type | ϒtot (KN/m3) | c’ or Su (kPa) | φ (deg) | Soil Model | Eoed (kPa) | exp (m) (-) |
0 | SF (Fill) | Sand | 20 | 0.1 | 30 | Elastoplastic | 25000 | - |
-1 | CF1 | Clay (Undrained) | - | 60 | 0 | Exponential | 30000 | 1 |
-4.5 | CF1 | Clay (Undrained) | 21 | 150 | 0 | Exponential | 225000 | 1 |
-9.3 | WR | Rock | 25 | 150 | 30 | Elastoplastic | 244000 | - |
-11.3 | SR | Rock | 26 | 250 | 30 | Elastoplastic | 3072000 | - |
Table 3: Ground Anchor Properties in the DeepEX Model
Anchor | Elev. (m) | Spacing (m) | Free Length (m) | Fixed Length (m) | Section (Strands) | Prestress (KN) |
Tieback 1 | -3.3 | 3.05 | 9.4 | 5 | 7x15mm | 1000 |
Tieback 2 | -8.3 | 3.05 | 3.9 | 3 | 7x15mm | 600 |
D. ANALYSIS ASSUMPTIONS IN DEEPEX
Limit Equilibrium Analysis (LEM)
Earth Pressures (Cantilever Excavation Stage): Active/Passive
Earth Pressures (Stages with supports): FHWA Apparent/Passive
Water Pressures: Simplified Flow
Wall Friction: No wall friction considered
Wall Analysis – Wall Beam: Free Earth Method (Cantilever) - California Trenching and Shoring Manual (CALTRANS)

Figure 3: Limit Equilibrium Analysis Settings – DeepEX Software.
Non-Linear Analysis (NL)
Wall Friction: 80% of the soil friction
Soil Springs Mesh Delta: 0.25m
Soil Models: Hyperbolic (Exponential)

Figure 4: Non-Linear Analysis Settings – DeepEX Software.
Finite Element Analysis (FEM)
Wall Friction: 66% to 80% of the soil friction
Generated Mesh Density: Coarse
Non-Linear Solver: Krylov-Newton
Soil Model: Soil Hardening Model
E. DEEPEX ANALYSIS RESULTS – PROJECT EVALUATION WITH ALL METHODS
With the Limit Equilibrium method, the software uses the conventional approach to calculate all pressures that are developed on the wall (earth active and passive side pressures, water pressures, external surcharges, seismic loads).
Net pressure diagrams are calculated for each stage.
The software uses the selected beam analysis method to calculate the wall moment and shear diagrams, the support reactions, and the wall embedment safety factors, as well as to estimate the wall displacements.
With the Non-Linear Analysis method, the software uses elastoplastic soil springs to simulate the connection of the soil with the wall.
Soil springs are also used to simulate the connection of the wall with installed supports.
The NL method takes into consideration the project construction sequence through staging.
The Winkler springs are initially placed in at-rest conditions, and along the construction stages, springs get activated and deactivated.
The software measures the effect on the springs, and from that loading it calculates all results.
the Finite Element Analysis method, both the structural components and the supporting soil medium are included in the simulation model.
The soil medium is modelled as a continuum while soil properties are introduced through elastoplastic constitutive laws (Mohr Coulomb, Soil Hardening, Hoek Brown etc).
Full soil structure interaction is considered and post processing results within the soil medium can be evaluated.
In the generated models, both the Non-Linear and the Finite Element Analysis methods can effectively simulate the wall displacement behavior and the expected bending moment diagrams in both support installation stages.

Figure 5: LEM Analysis – Wall Moment and Displacement Diagrams, Support Reactions Wall Embedment Safety Factors (Stage 2 – First Support Row Installation).

Figure 6: LEM Analysis – Wall Moment and Displacement Diagrams, Support Reactions Wall Embedment Safety Factors (Stage 4 – Second Support Row Installation).

Figure 7: NL Analysis – Wall Moment and Displacement Diagrams, Support Reactions Wall Embedment Safety Factors (Stage 2 – First Support Row Installation).

Figure 8: NL Analysis – Wall Moment and Displacement Diagrams, Support Reactions Wall Embedment Safety Factors (Stage 4 – Second Support Row Installation).

Figure 9: FEM Analysis – Wall Moment and Displacement Diagrams, Support Reactions Wall Embedment Safety Factors (Stage 2 – First Support Row Installation).

Figure 10: FEM Analysis – Wall Moment and Displacement Diagrams, Support Reactions Wall Embedment Safety Factors (Stage 4 – Second Support Row Installation).
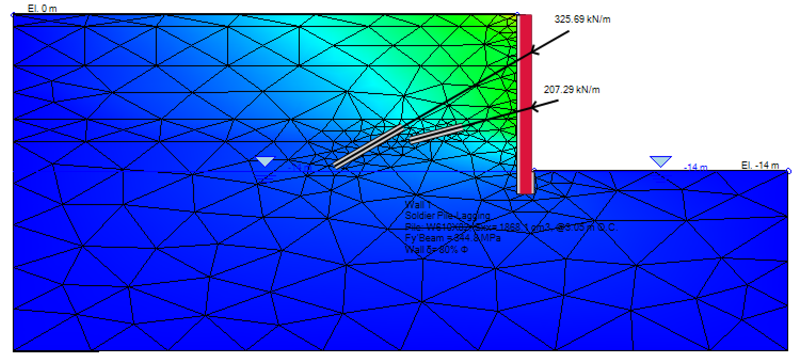
Figure 11: FEM Analysis – Soil Mass Horizontal Displacement Shadings and Generated Mesh
(Stage 5 – Final Excavation Stage)

Figure 12: FEM Analysis – Total Displacement Arrows and Generated Mesh
(Stage 5 – Final Excavation Stage)
